Proven Results
Speed Results Matrix
Real performance improvements from real client projects. See the before and after metrics that speak for themselves.
72%
Avg. Load Time Reduction
Across all client projects
96/100
Avg. Performance Score
Post-optimization average
34%
Conversion Rate Increase
Average improvement
45%
Bounce Rate Reduction
Better user engagement
Client Case Studies
Detailed performance transformations across different industries and use cases.
E-Commerce Platform
Retail
Before
42
After
96
LCP
4.8s 1.2s
↓ 75%
CLS
0.32 0.02
↓ 94%
FID
280ms 45ms
↓ 84%
Load Time
6.2s 1.8s
↓ 71%
Key Optimizations:
- Implemented critical CSS extraction
- Optimized image delivery with WebP/AVIF
- Deployed edge caching for 95% cache hit ratio
- Reduced third-party script impact by 60%
SaaS Dashboard
Technology
Before
51
After
98
LCP
3.9s 0.9s
↓ 77%
CLS
0.28 0.01
↓ 96%
FID
195ms 32ms
↓ 84%
Load Time
5.1s 1.4s
↓ 73%
Key Optimizations:
- Migrated to server-side rendering
- Implemented code splitting and lazy loading
- Optimized API response times by 65%
- Reduced JavaScript bundle size by 72%
News Publication
Media
Before
38
After
94
LCP
5.2s 1.5s
↓ 71%
CLS
0.41 0.03
↓ 93%
FID
320ms 58ms
↓ 82%
Load Time
7.8s 2.1s
↓ 73%
Key Optimizations:
- Implemented AMP for article pages
- Optimized ad loading strategy
- Deployed multi-CDN with geo-routing
- Reduced layout shift from dynamic content
Financial Services
Finance
Before
48
After
97
LCP
4.1s 1.1s
↓ 73%
CLS
0.25 0.02
↓ 92%
FID
210ms 38ms
↓ 82%
Load Time
5.6s 1.6s
↓ 71%
Key Optimizations:
- Implemented streaming SSR
- Optimized database query performance
- Deployed intelligent prefetching
- Reduced Time to Interactive by 68%
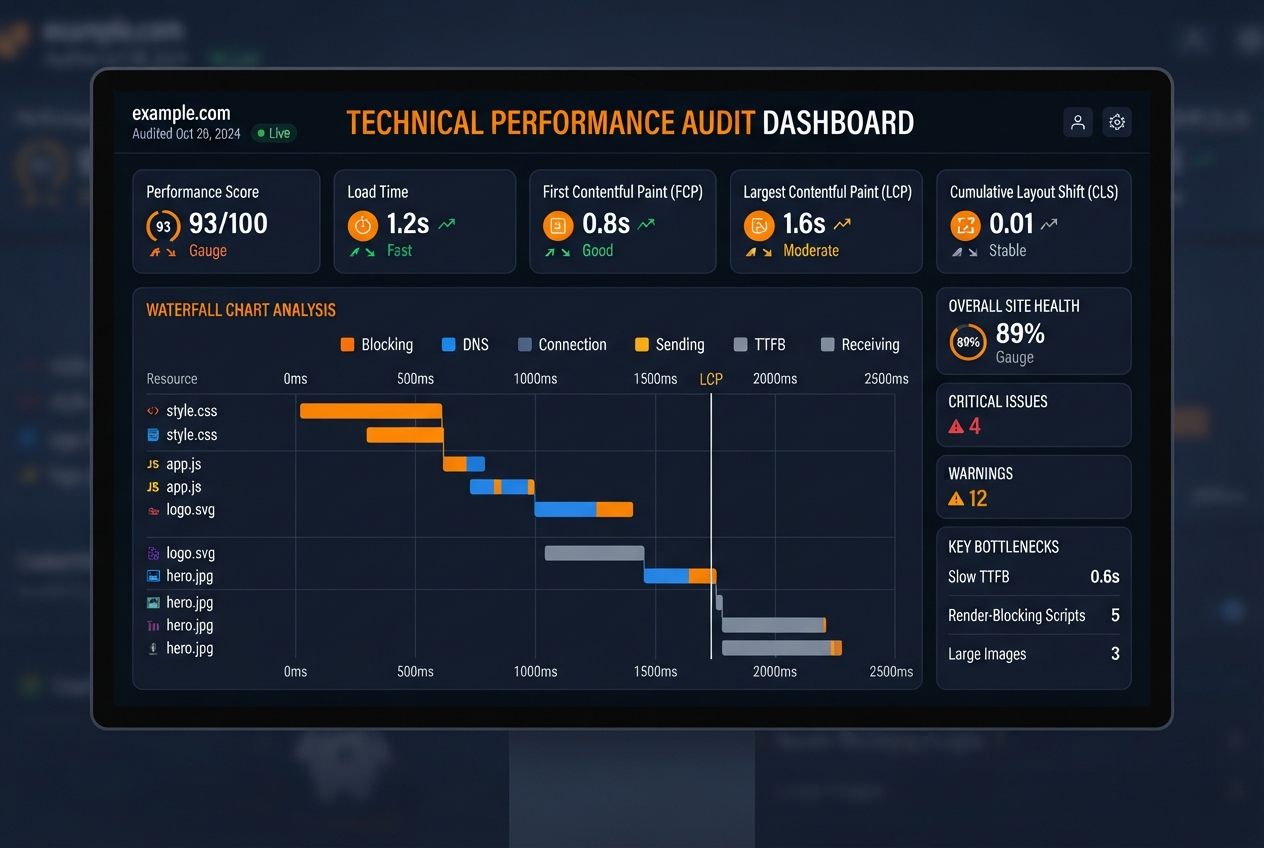
Detailed Performance Analytics
Our custom dashboard provides real-time performance monitoring with waterfall charts, Core Web Vitals tracking, and actionable insights.
- Real-time performance monitoring
- Waterfall chart visualization
- Core Web Vitals tracking
- Historical trend analysis
- Automated alert system
- Custom reporting and exports
96/100
Average Score
Ready to See Your Results?
Get a free performance audit and discover how much faster your website can be.
Start Your Optimization